Media Measurement
In the reporting calculation for campaign reports on the Lynx SSP Platform, three metrics are used: Reach, Frequency, to generate Impression. The calculation for these metrics is as follows: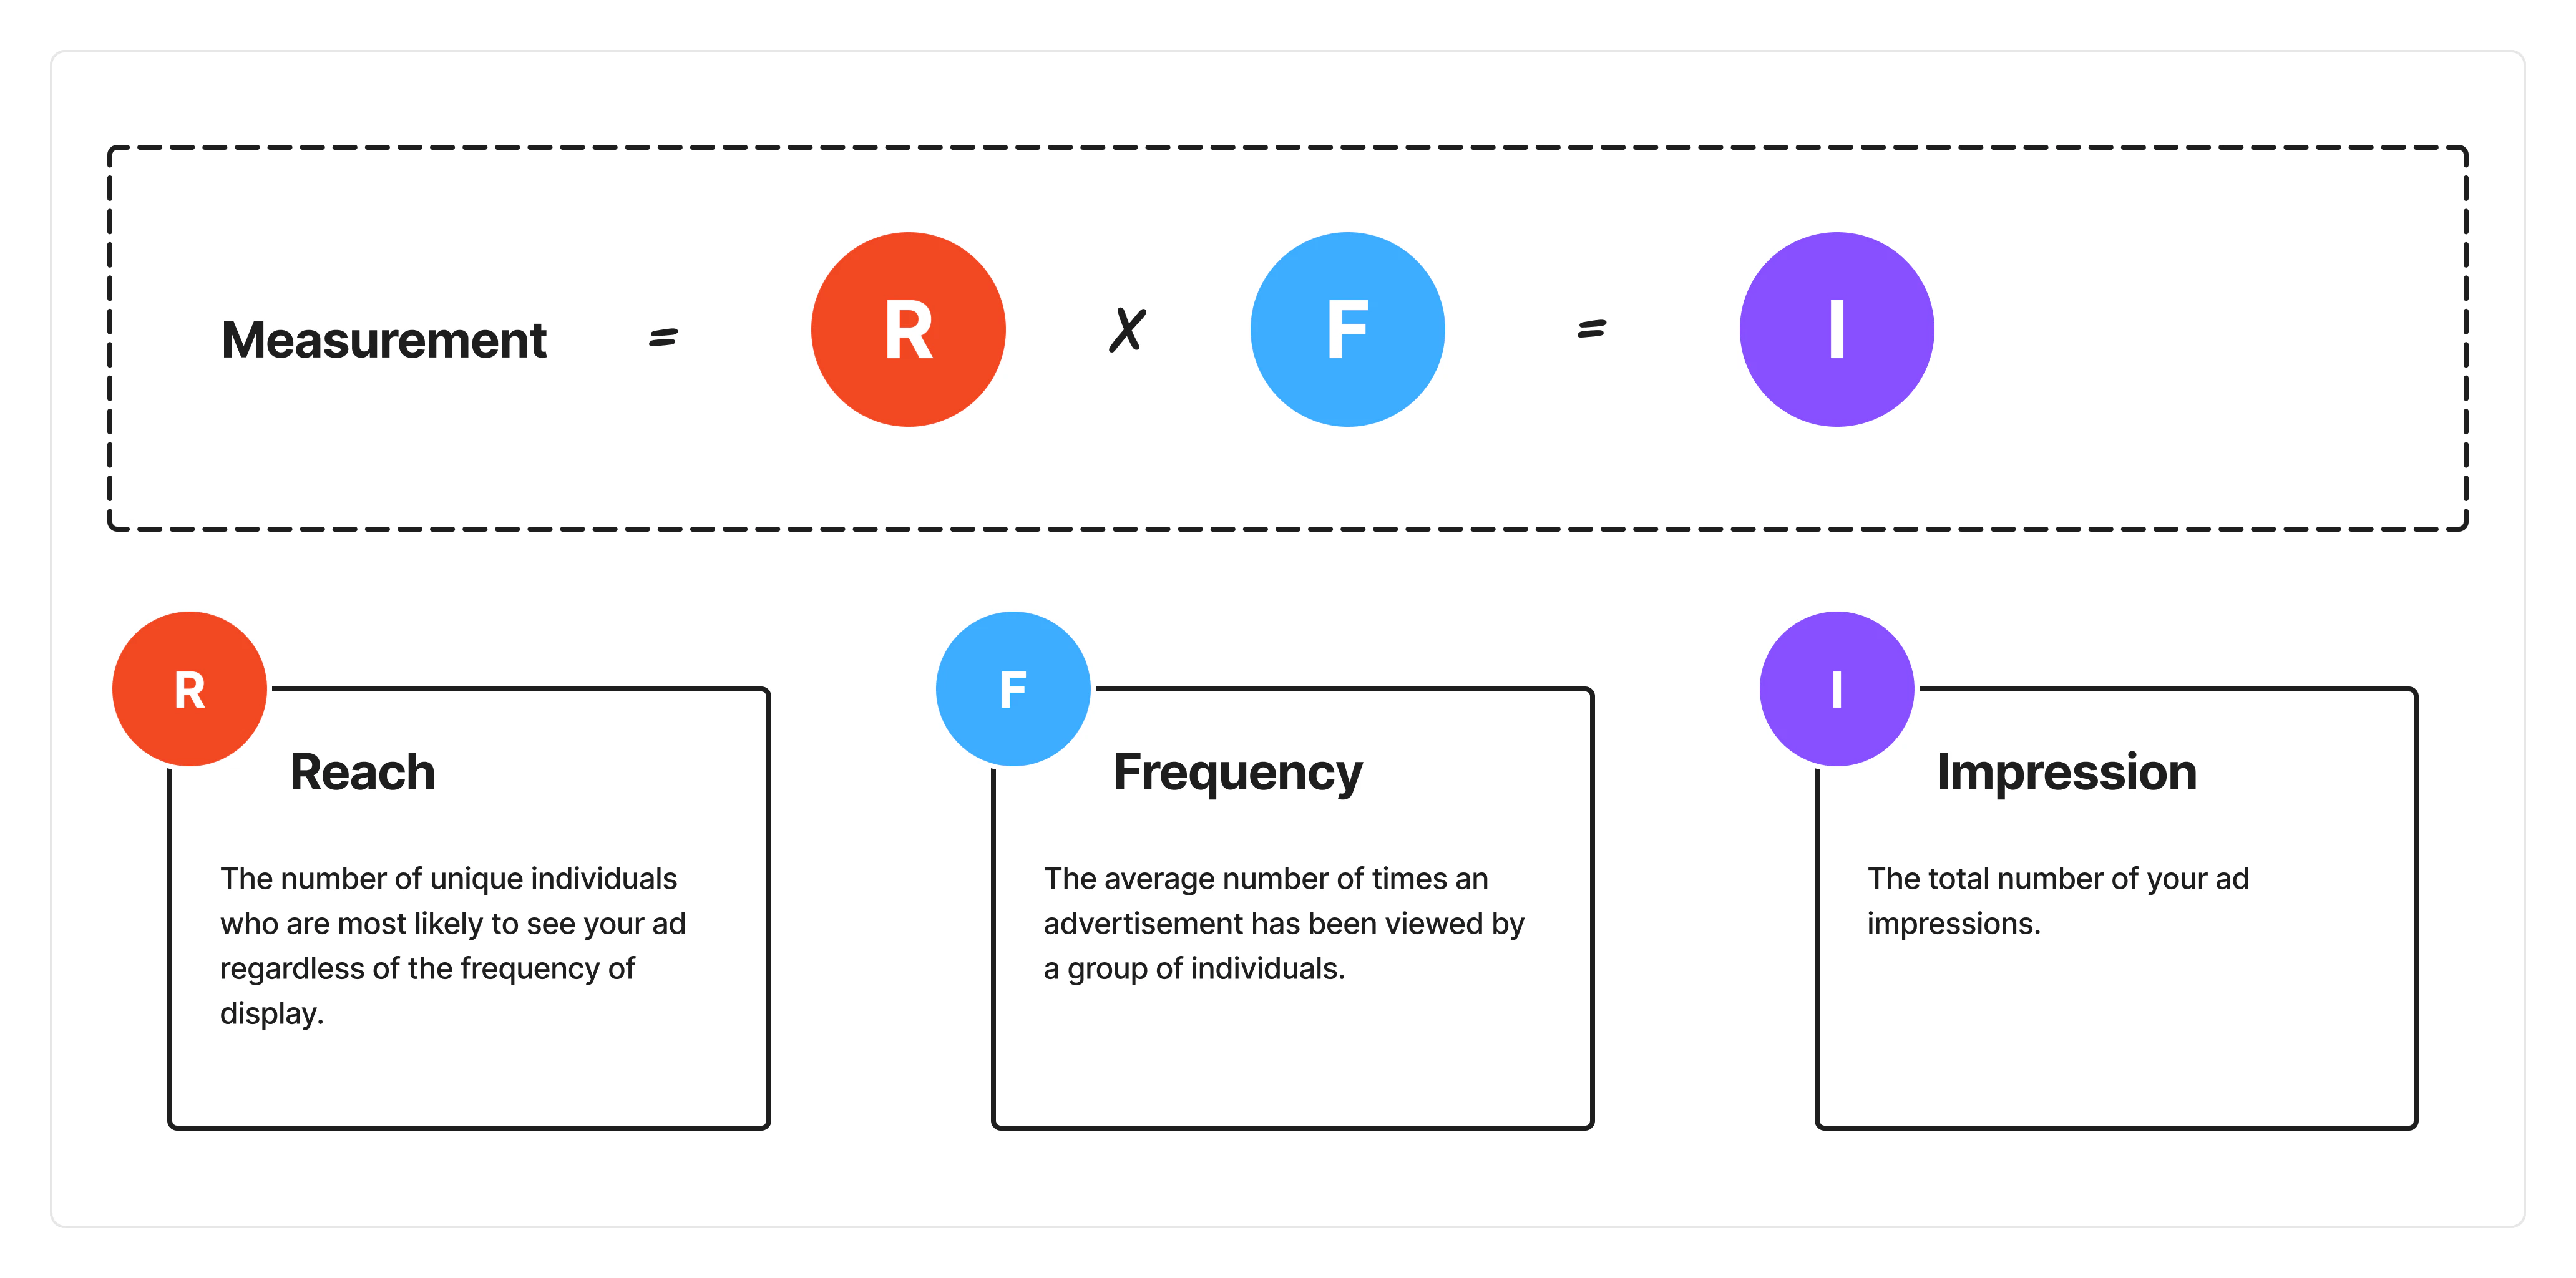
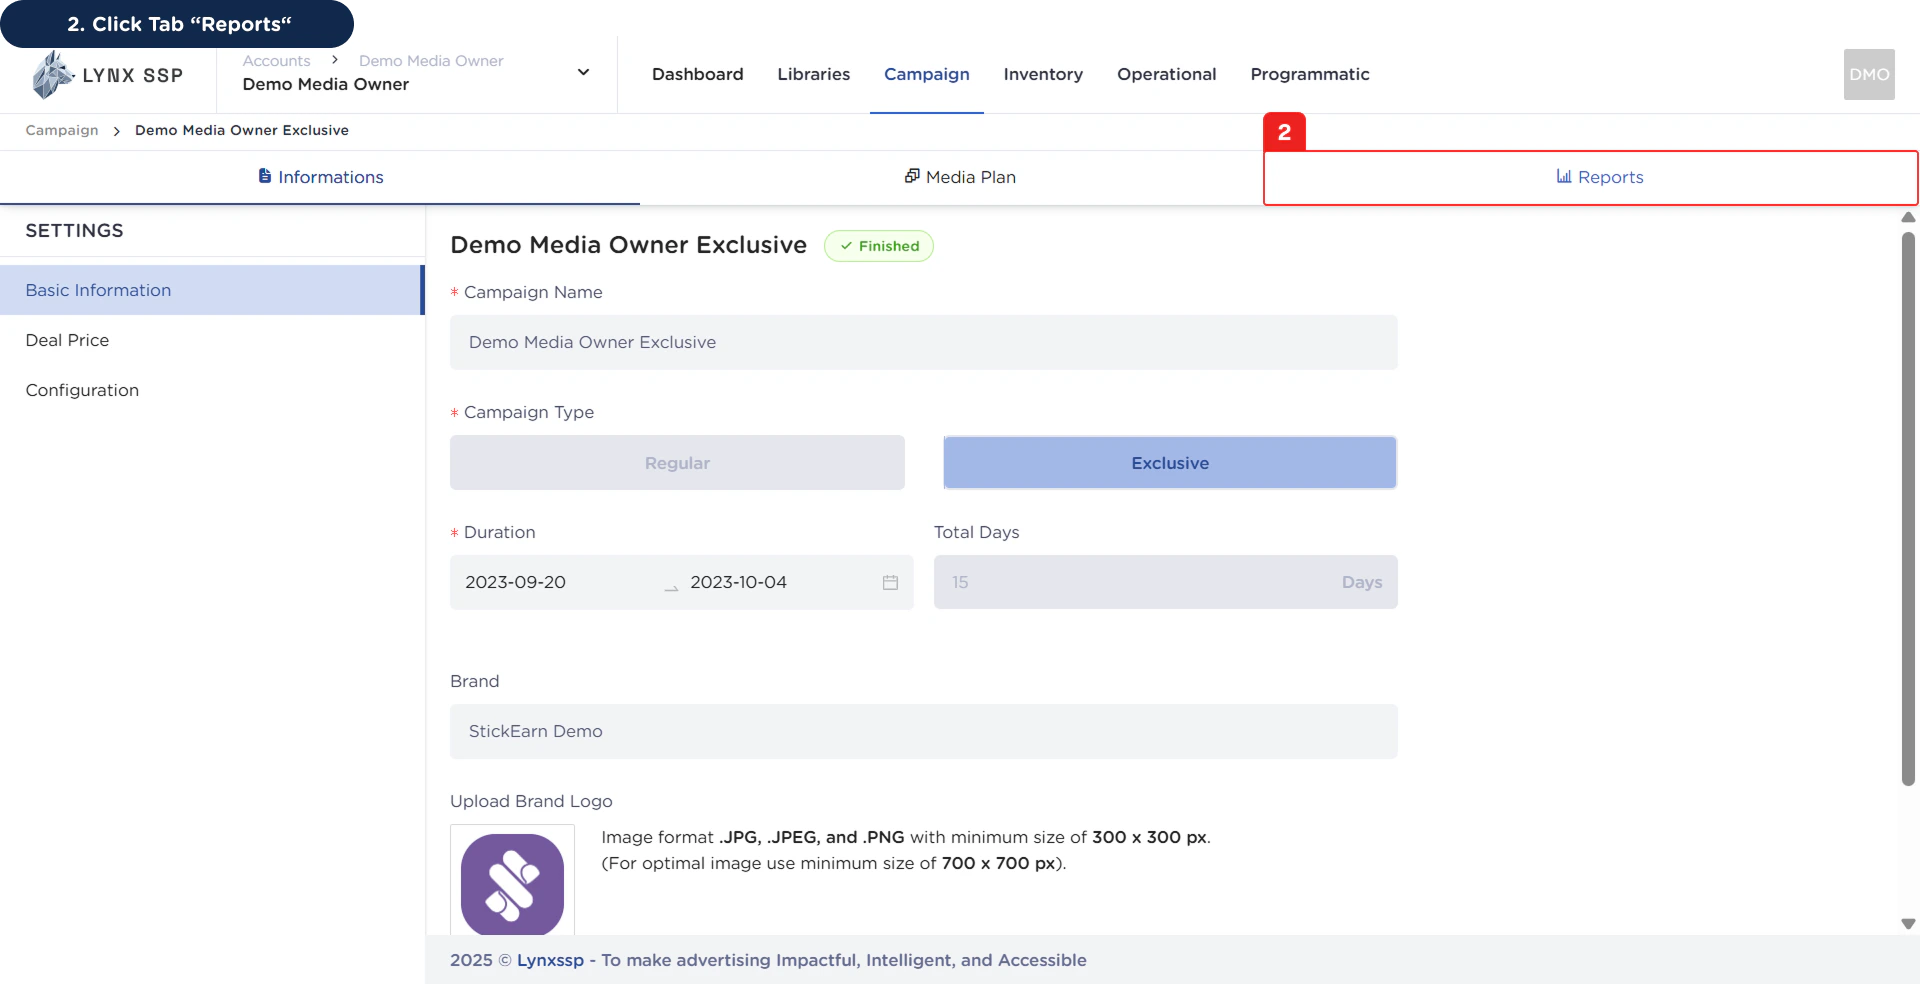
Accessing Campaign Reporting (Reports)
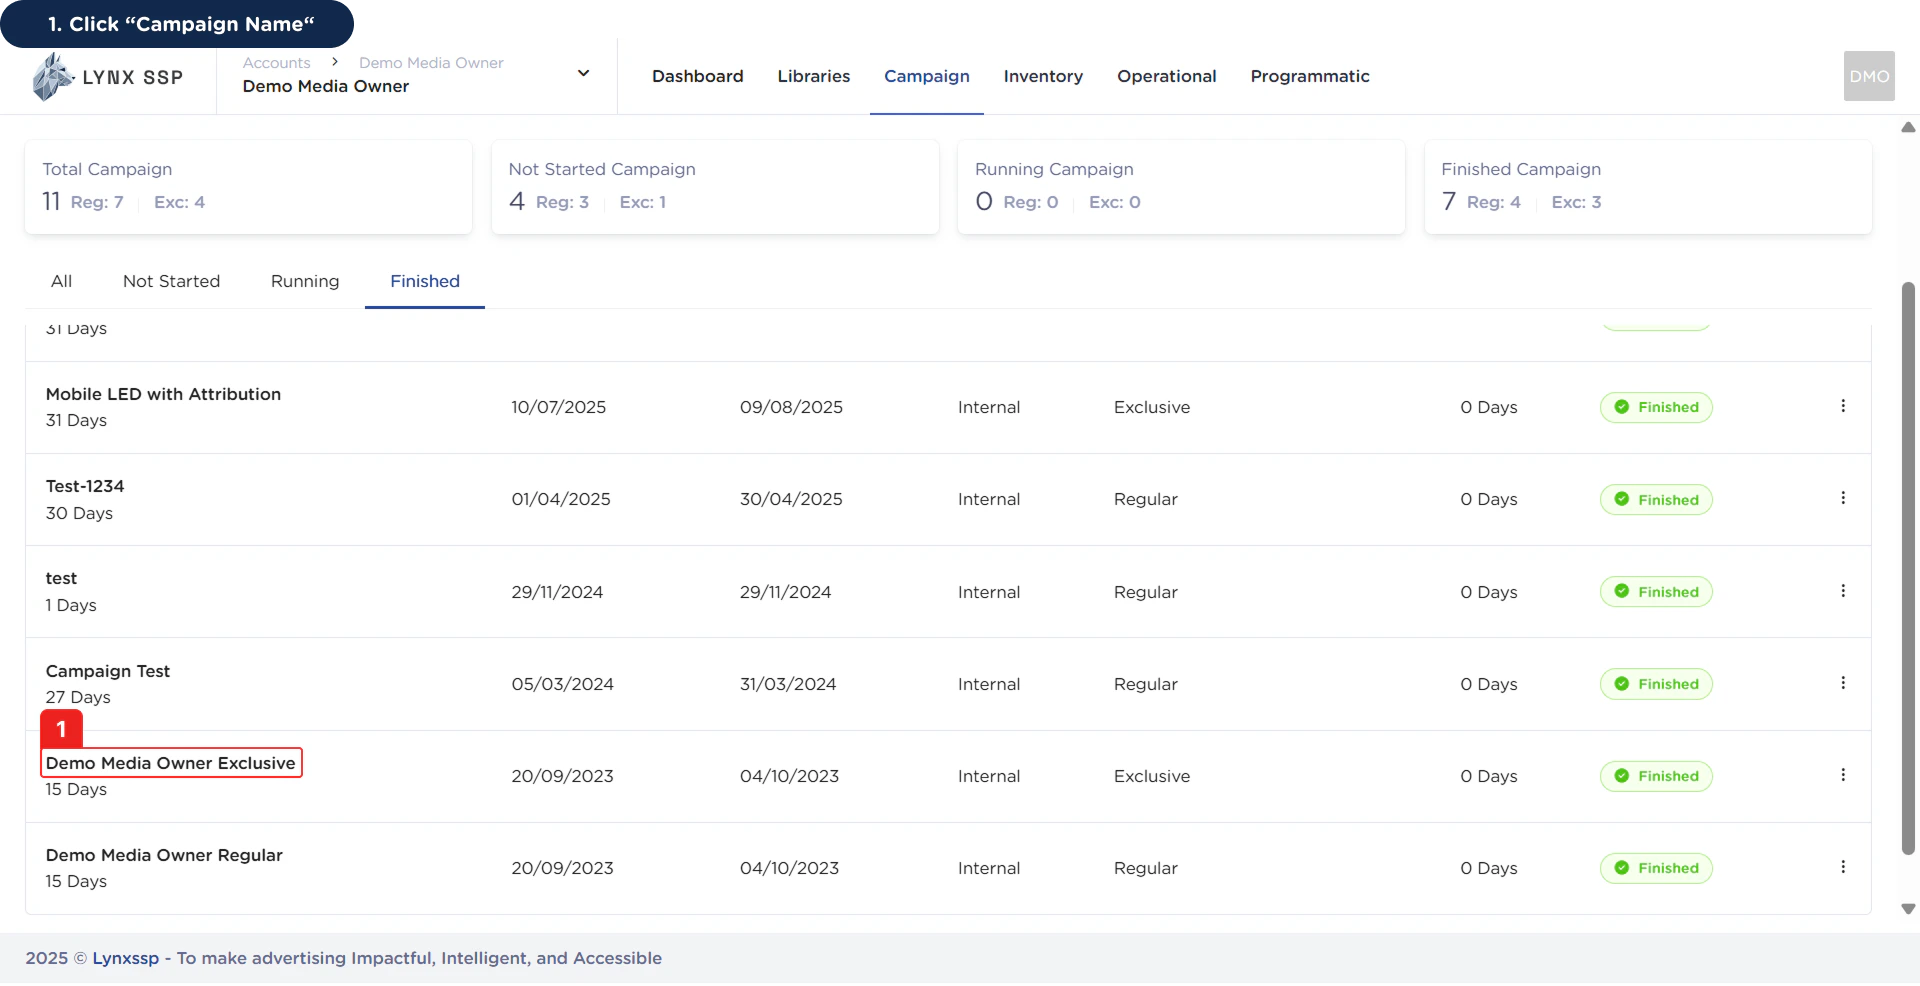
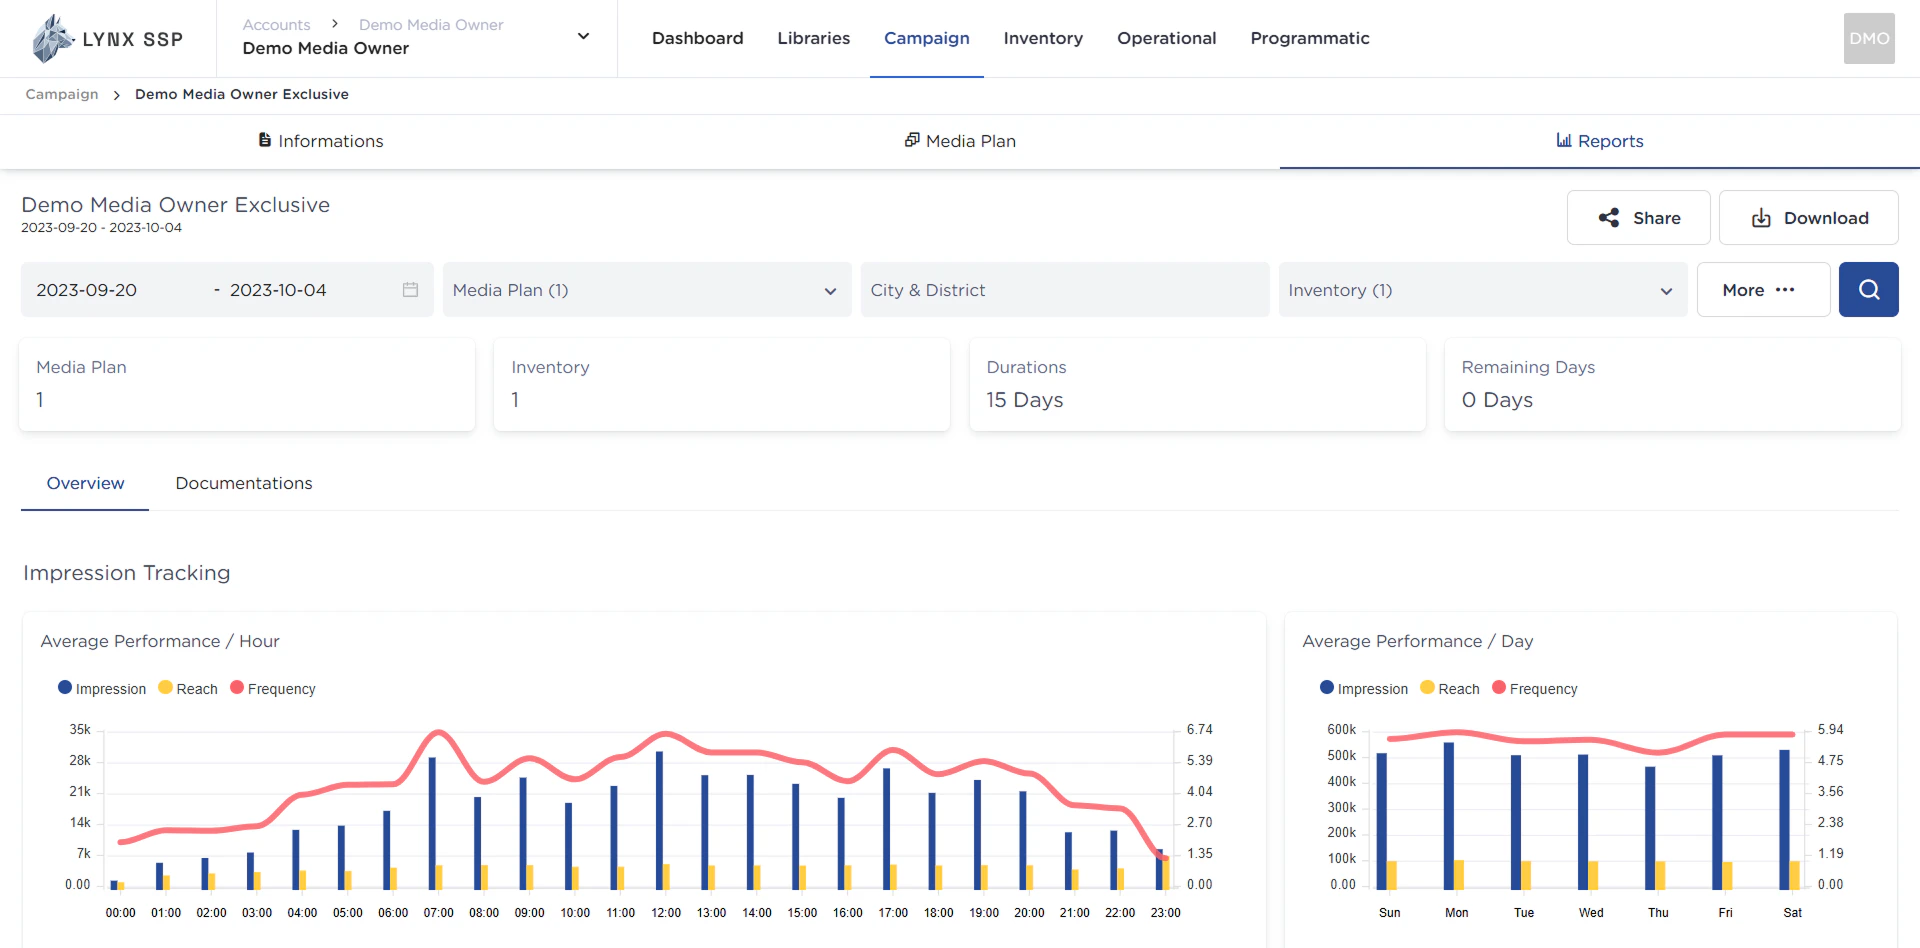
Campaign Reports Overview
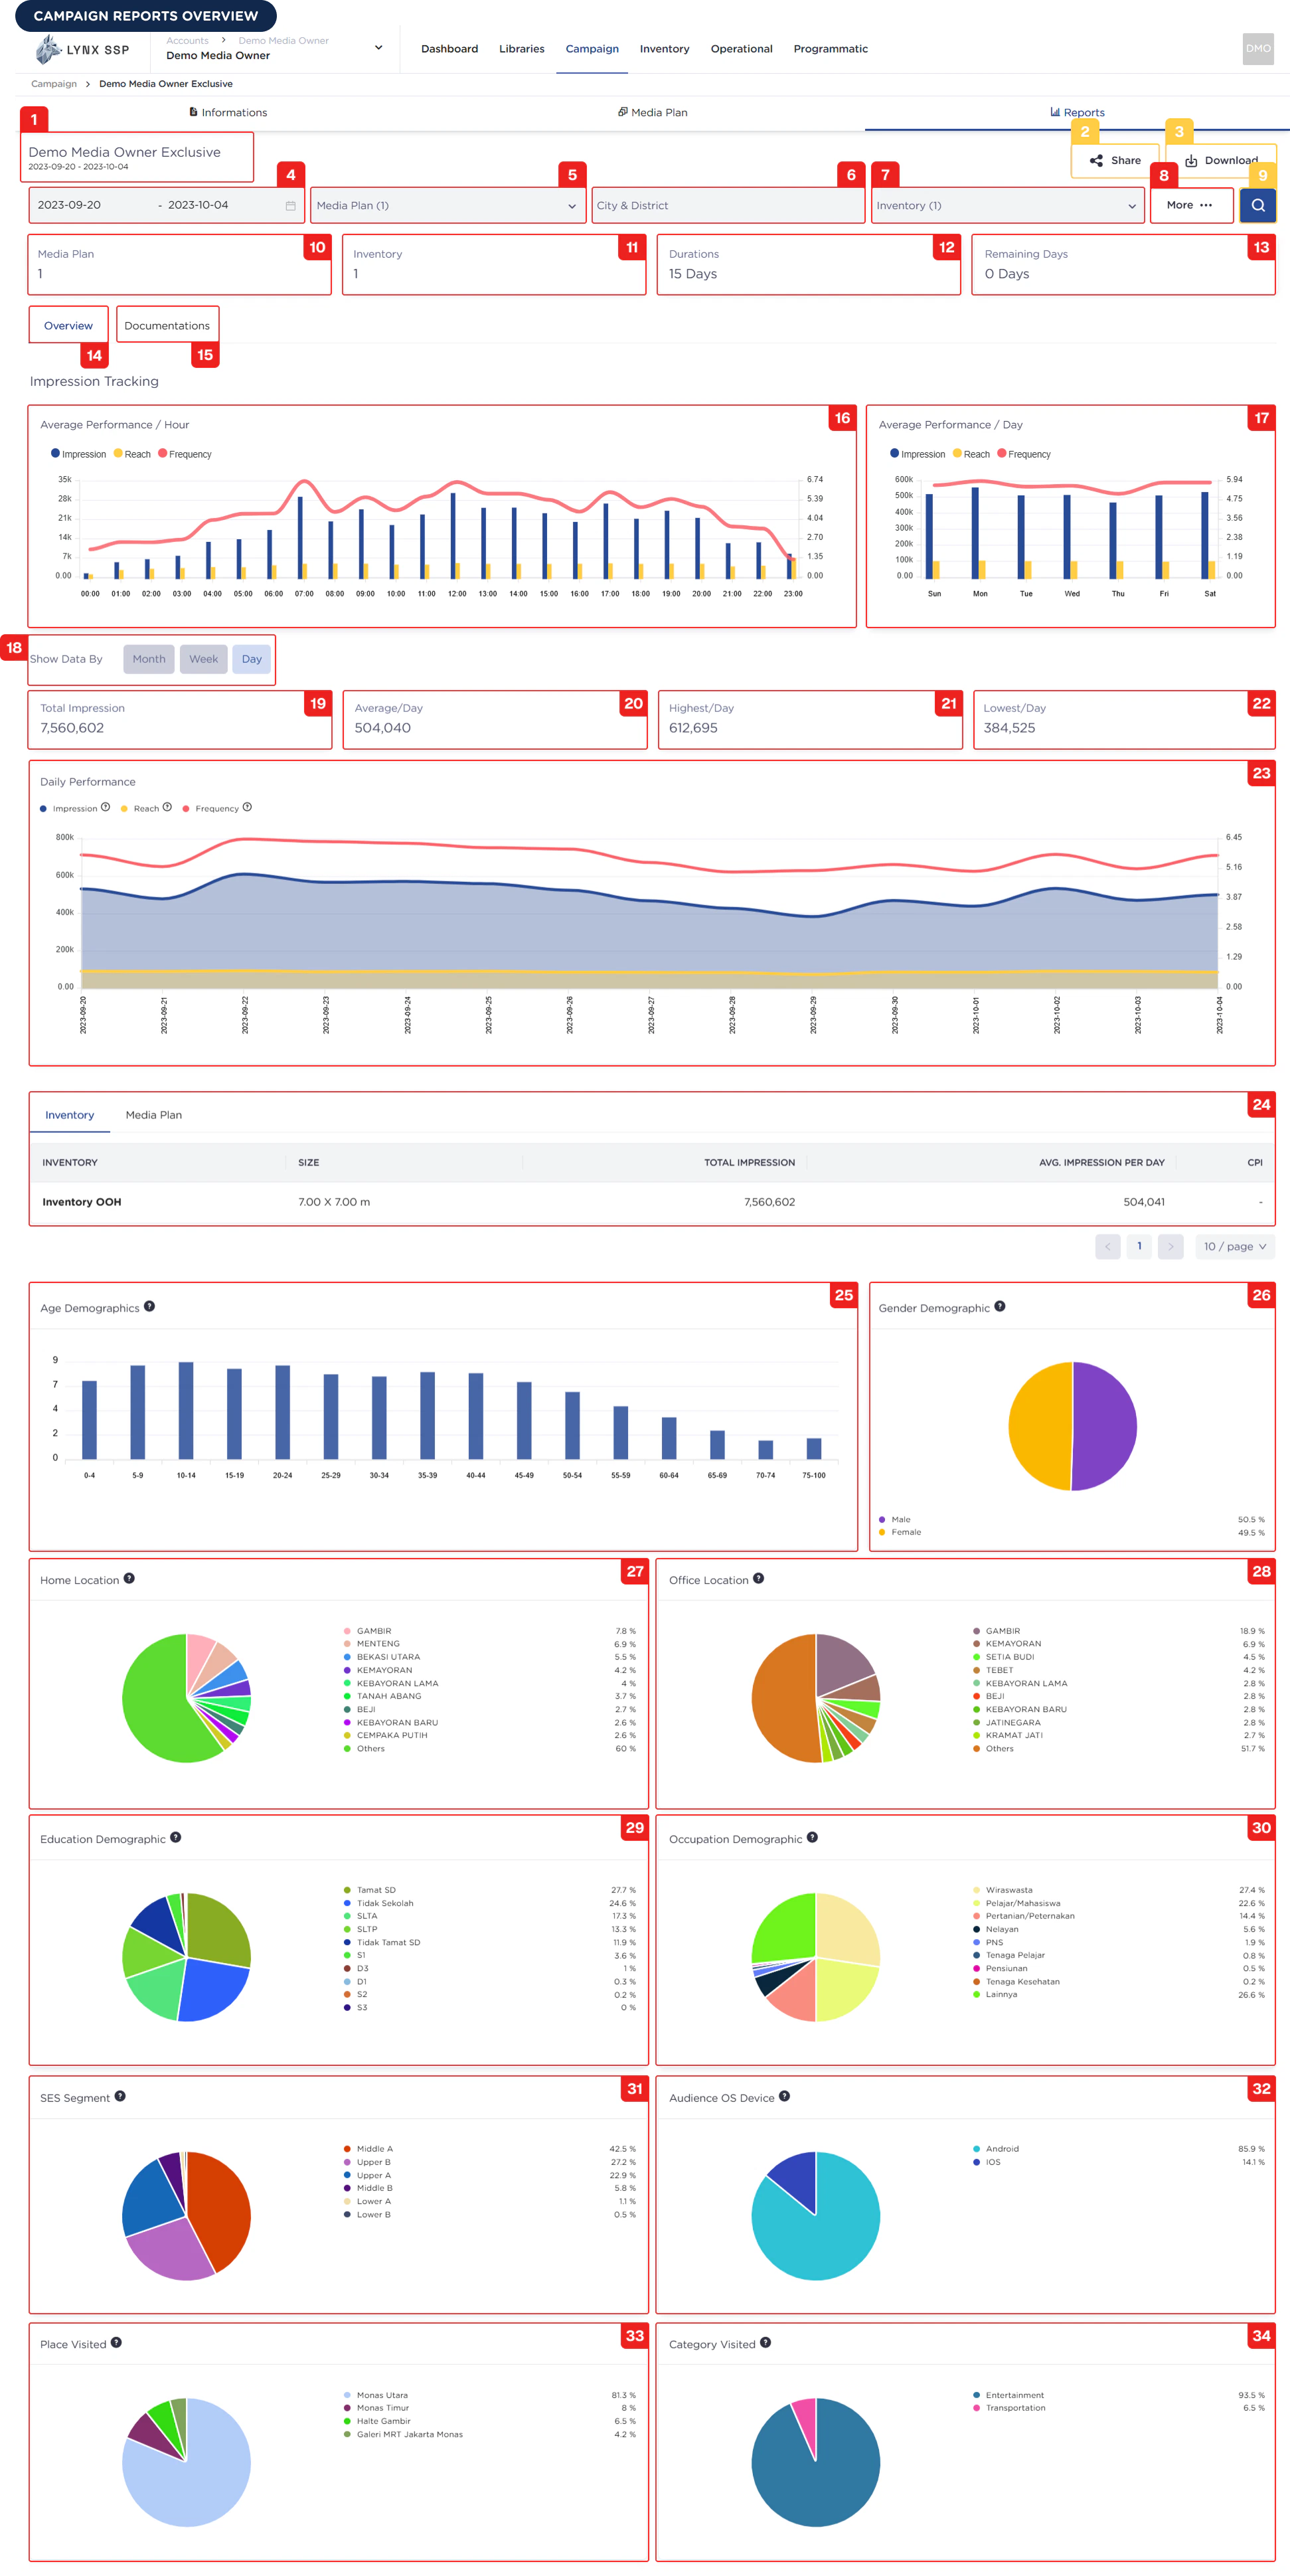
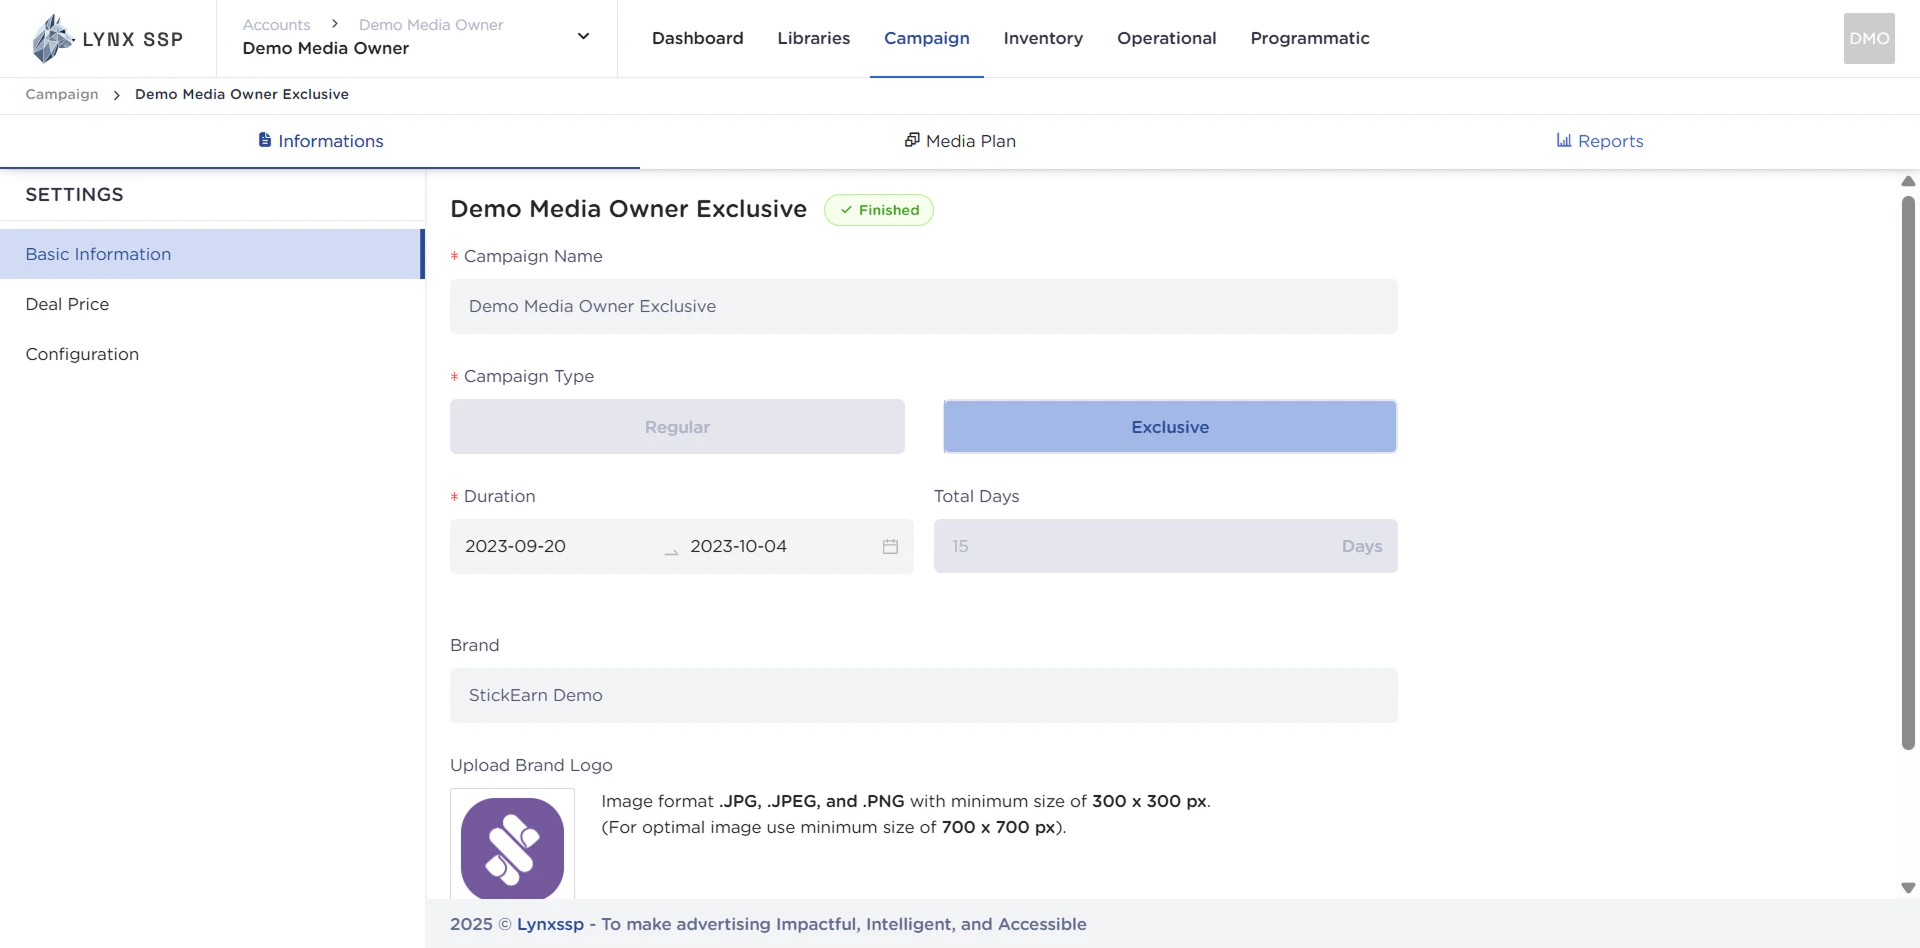
Campaign Name and Period
Information regarding the name of the campaign and the campaign period (duration).Share Campaign Report Button
This button is used to generate a web link that you can then provide to your clients, allowing them to access the campaign report directly via a web browser (See Share Campaign Report ↗).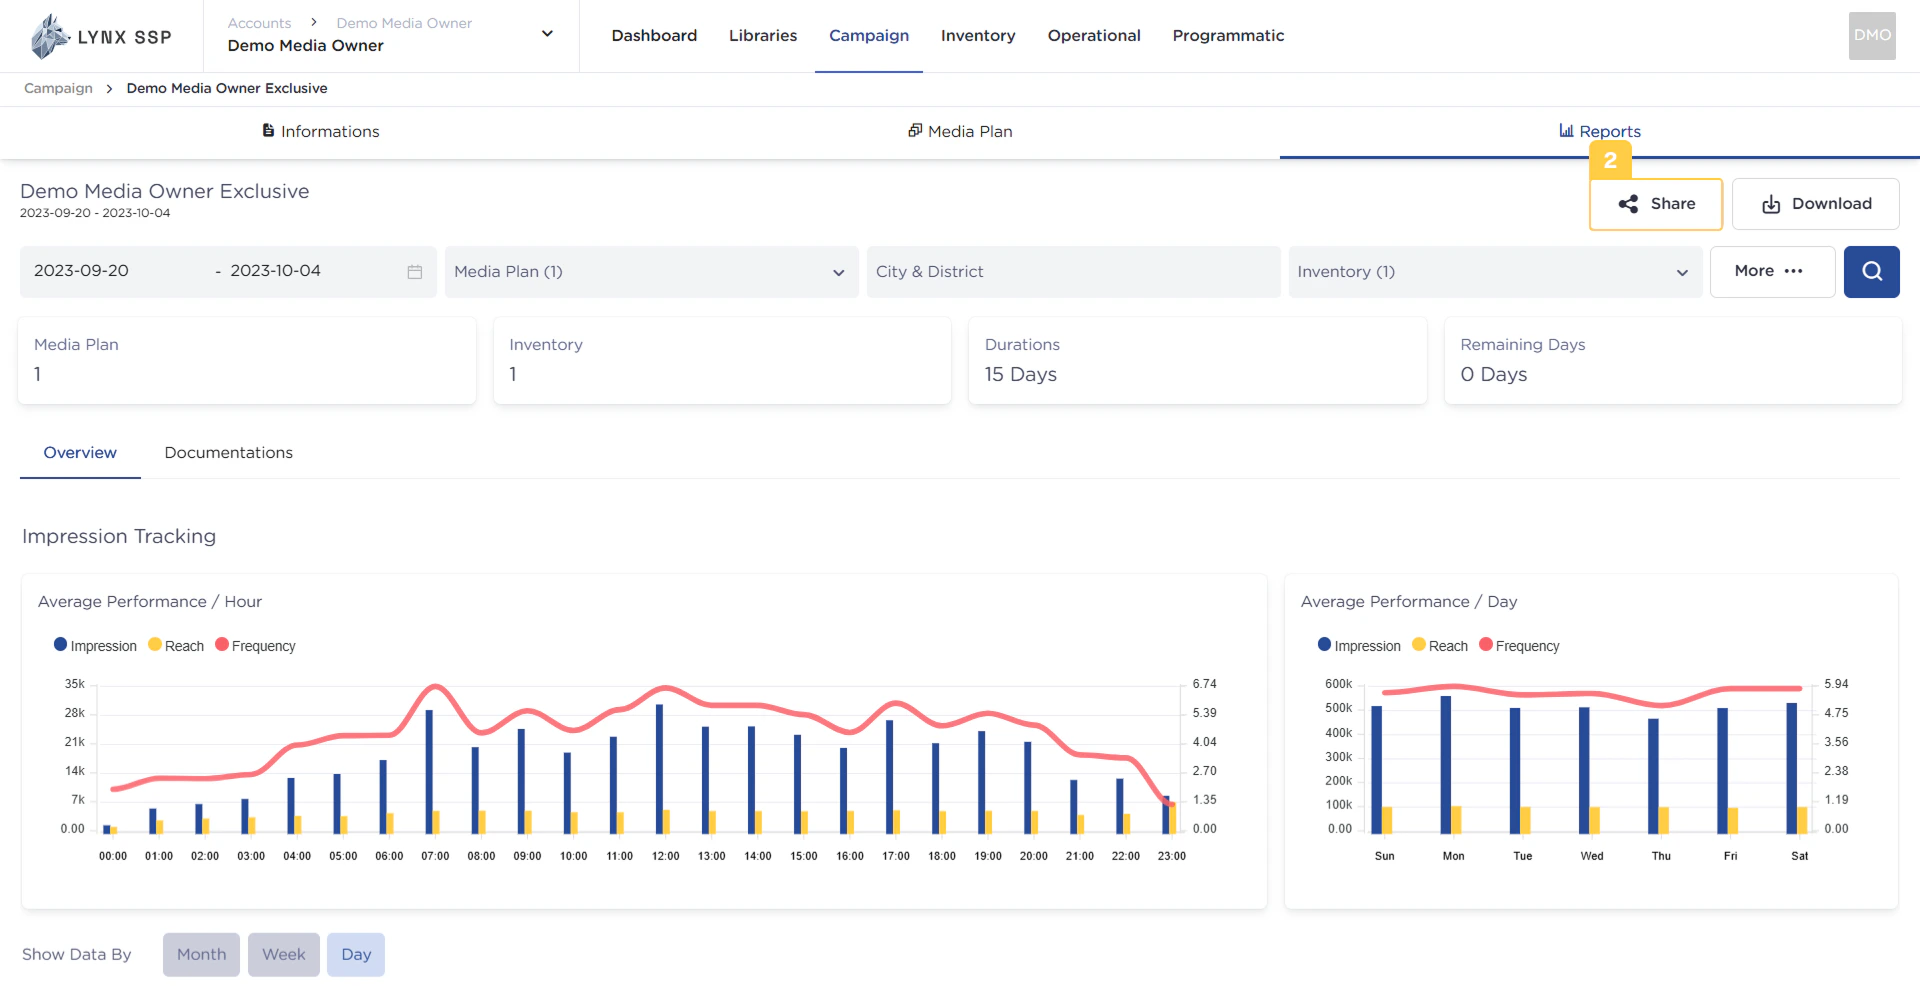
Download Campaign Report Button
This button is used to download the desired campaign report. The successfully downloaded report will be in PDF file format (See Download Campaign Report ↗).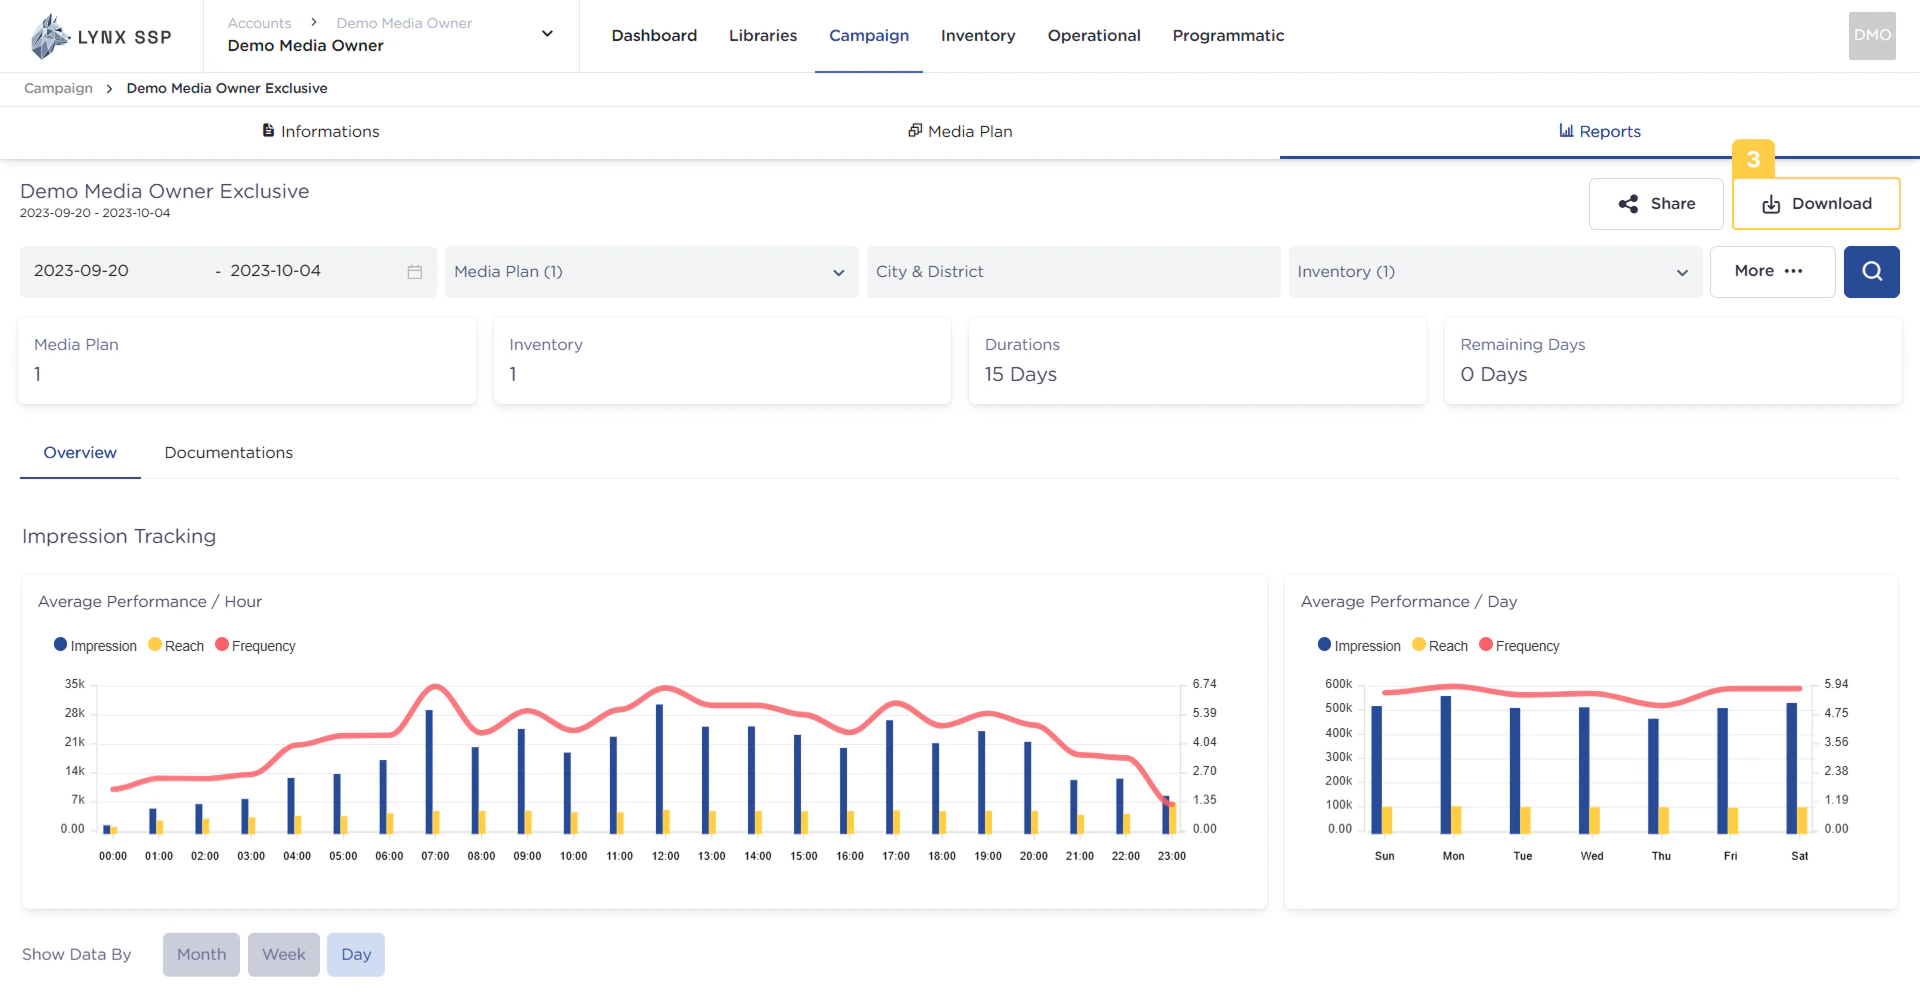
Filter by Date Range
The date range that can be used on this page is the range from the campaign schedule you previously applied (See Create a Campaign ↗). By default, the selected date range in this filter is 1 month backward (if the campaign period is longer than 1 month).Filter by Media Plan
The data displayed on this page can be filtered based on the Media Plan. If a single campaign contains multiple media plans, you can specifically choose to display the campaign report only for a certain Media Plan.Filter by City & District
The data displayed on this page can be filtered based on the City or District where the Inventory point is located.Filter by Inventory
The data displayed on this page can be filtered based on the specific Inventory item you want.Filter Menu
Through the filter menu, you can perform filtering or refining of campaign reporting data to better suit your needs. The filters available include:- Filter by Date Range
- Filter by Media Plan
- Filter by Inventory
- Filter by Display Type
- Filter by Creative
- Filter by Inventory Size
Filtering Search Button
After you have performed the filtering (Points No. 4, 5, 6, and 7), you can press this search button, and the campaign report will display data based on your specific requirements.Media Plan Information
The total number of media plans contained within a campaign.
Inventory Information
The total number of inventory items contained within a campaign.
Total Campaign Duration Information
The total duration of a campaign. The unit used is days.
Total Remaining Campaign Days Information
The total remaining duration of a campaign. The unit used is days.
Overview Tab
This tab indicates that you are currently on the summary (overview) section of a campaign report.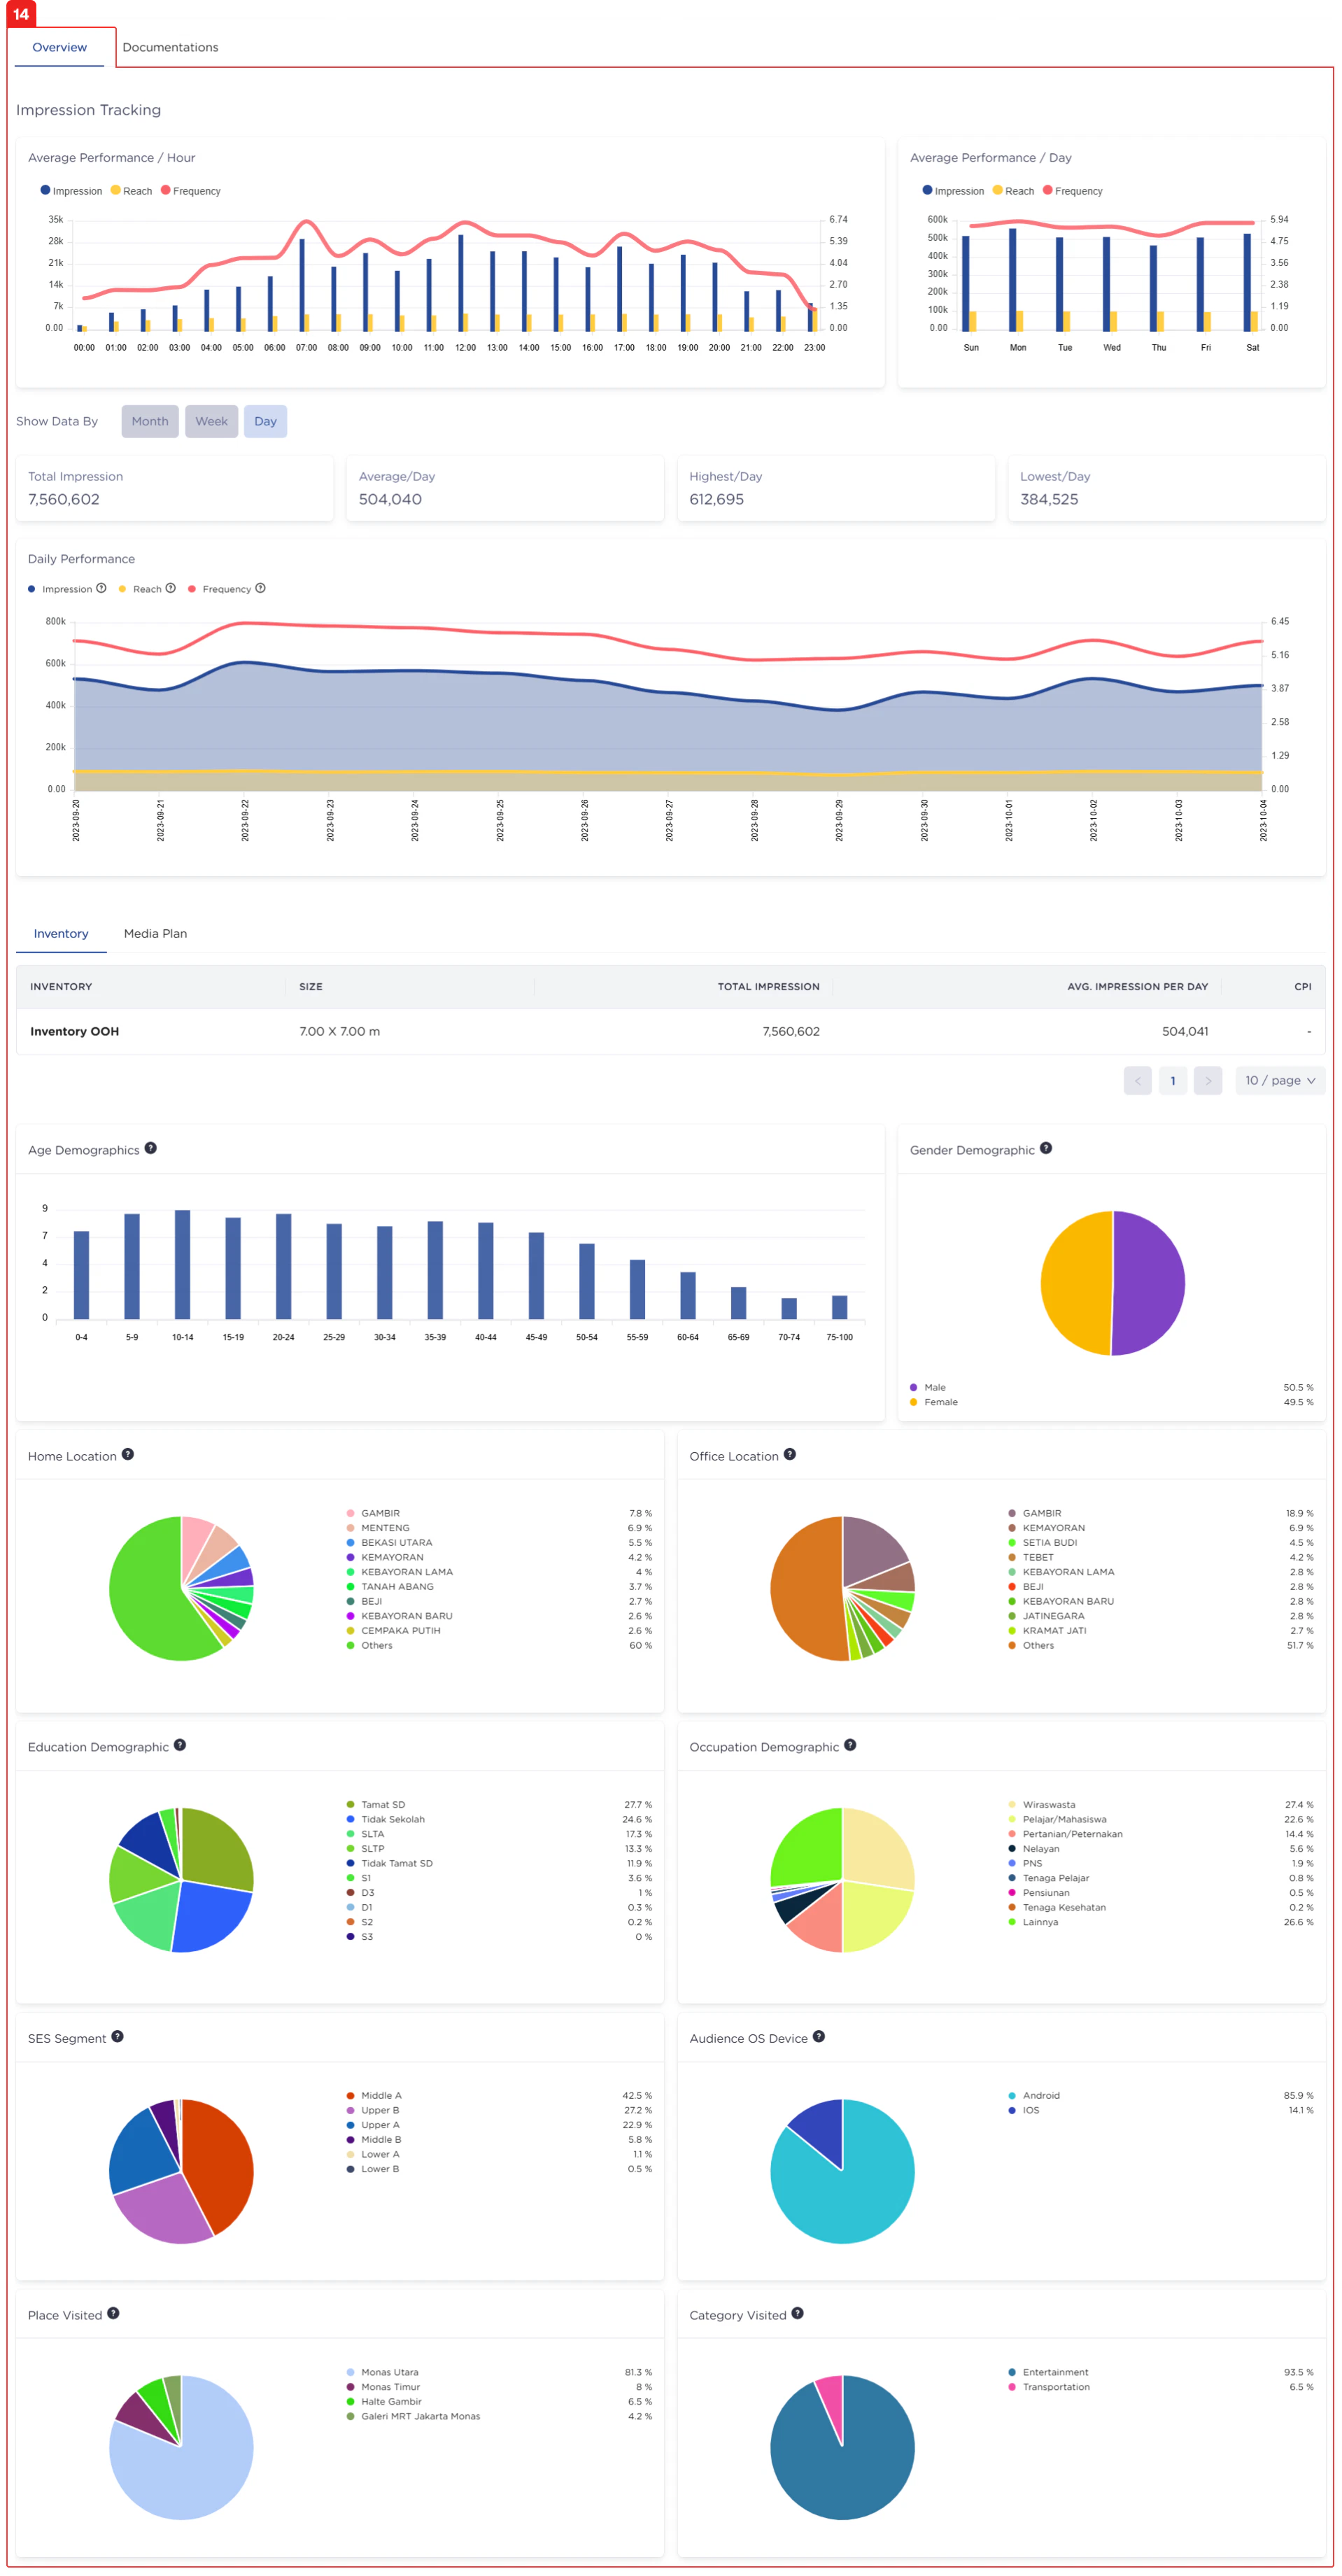
Documentation Tab
This panel tab indicates that you are currently in the documentation section of a campaign report. This section contains proof of airing (Proof of Play/PoP) that confirms the client’s advertisement has been displayed on your billboards.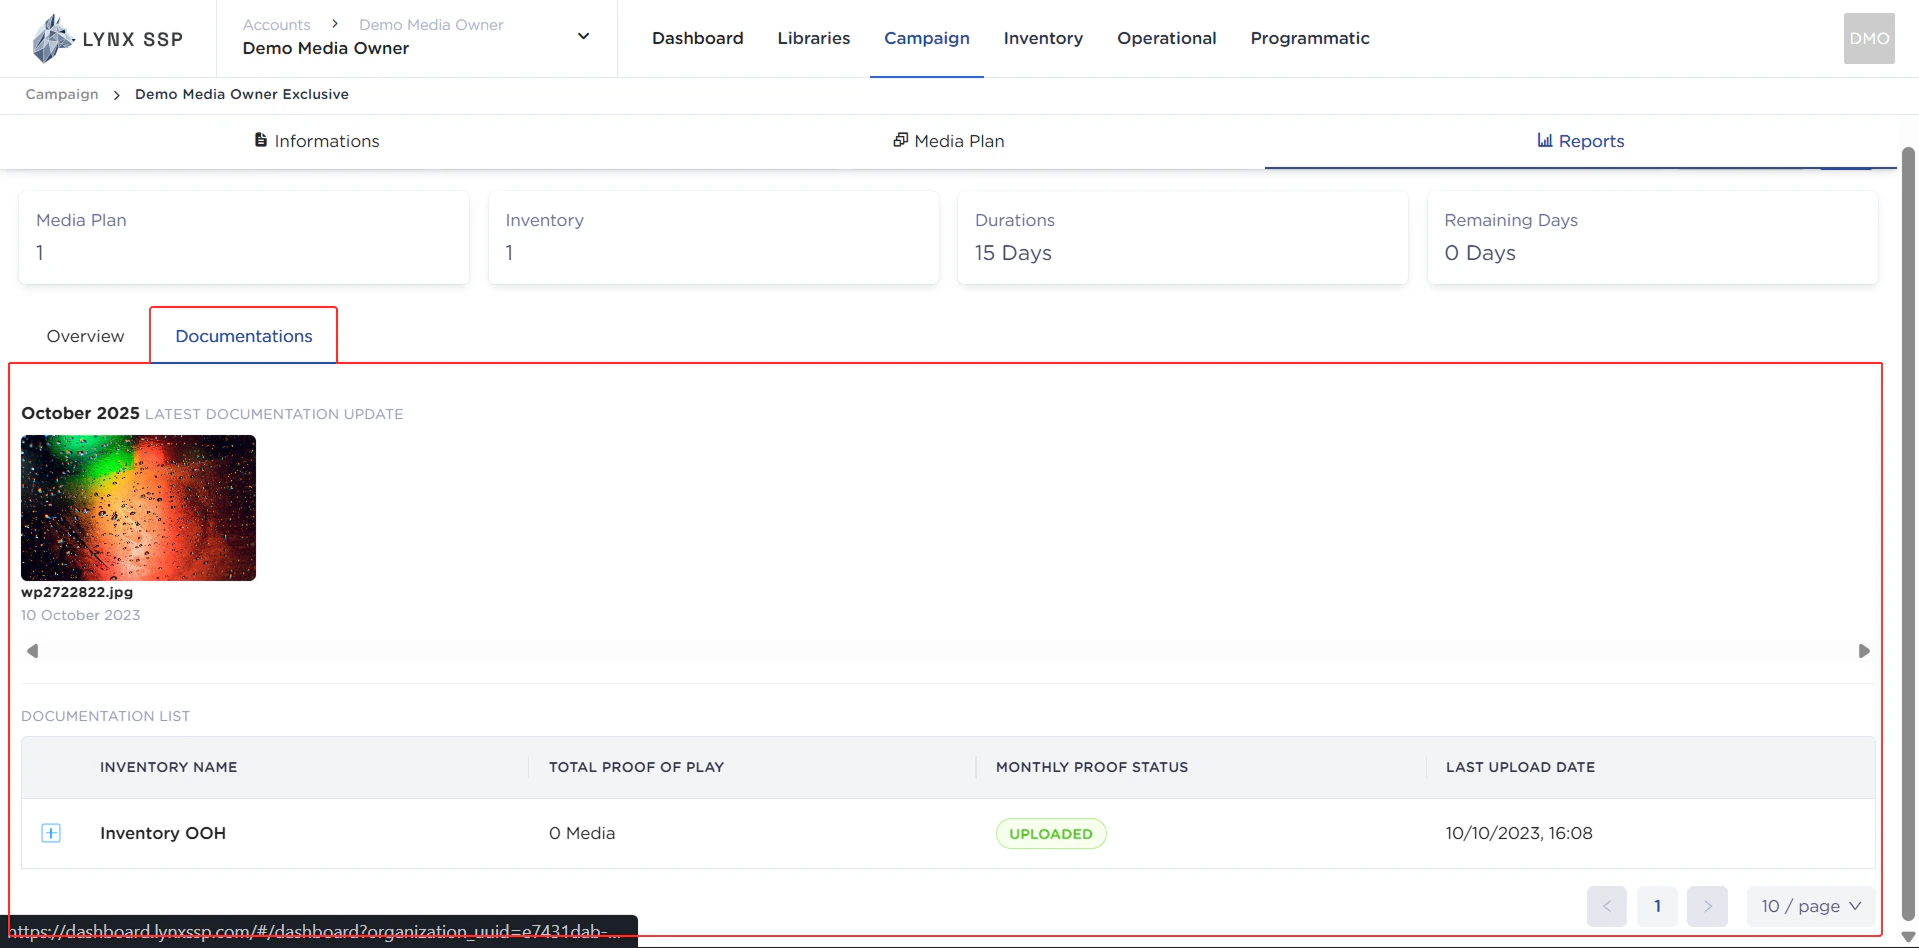
Average Performance per Hour Graph
This graph is an impression tracking graph that displays the average achievement of impression, reach, and frequency per hour generated by a campaign, based on a specific time period determined in the date range filter (Point No. 4).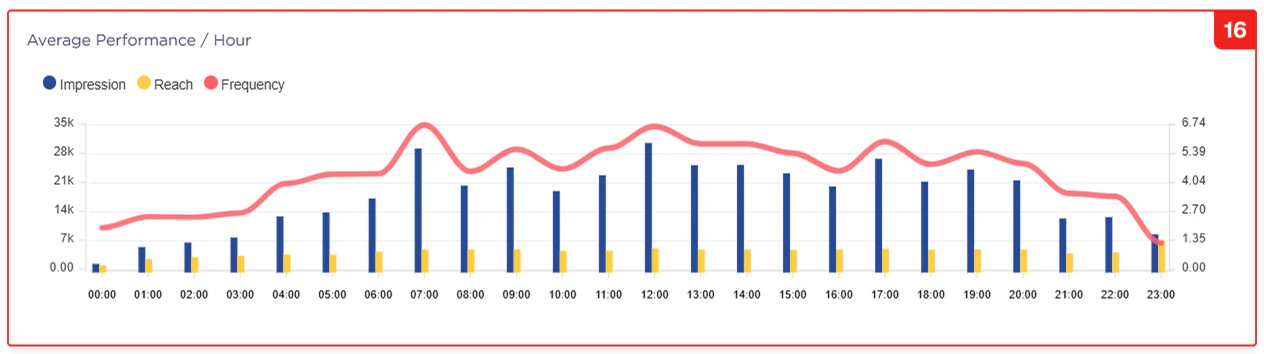
Average Performance per Day Graph
This graph is an impression tracking graph that displays the average achievement of impression, reach, and frequency per day generated by a campaign, based on a specific time period determined in the date range filter.
Filter by Monthly, Weekly, & Daily
This filter is used to change the presentation of the impression or playlog data obtained, allowing it to be viewed by month, week, or day.Total Impression Widget
The total impressions generated from one or more media plans/inventory items within a campaign.
Average Impression per Day Information Widget
The average impressions generated per day from one or more media plans/inventory items within a campaign.
Highest Impression per Day Information Widget
The highest total impressions achieved in a single day generated from one or more media plans/inventory items within a campaign.
Lowest Impression per Day Information Widget
The lowest total impressions achieved in a single day generated from one or more media plans/inventory items within a campaign.
Daily Performance Graph
This graph displays the total achievement (number) of impression, reach, and frequency per day generated from a campaign, based on a specific time period determined in the date range filter (Point No. 5).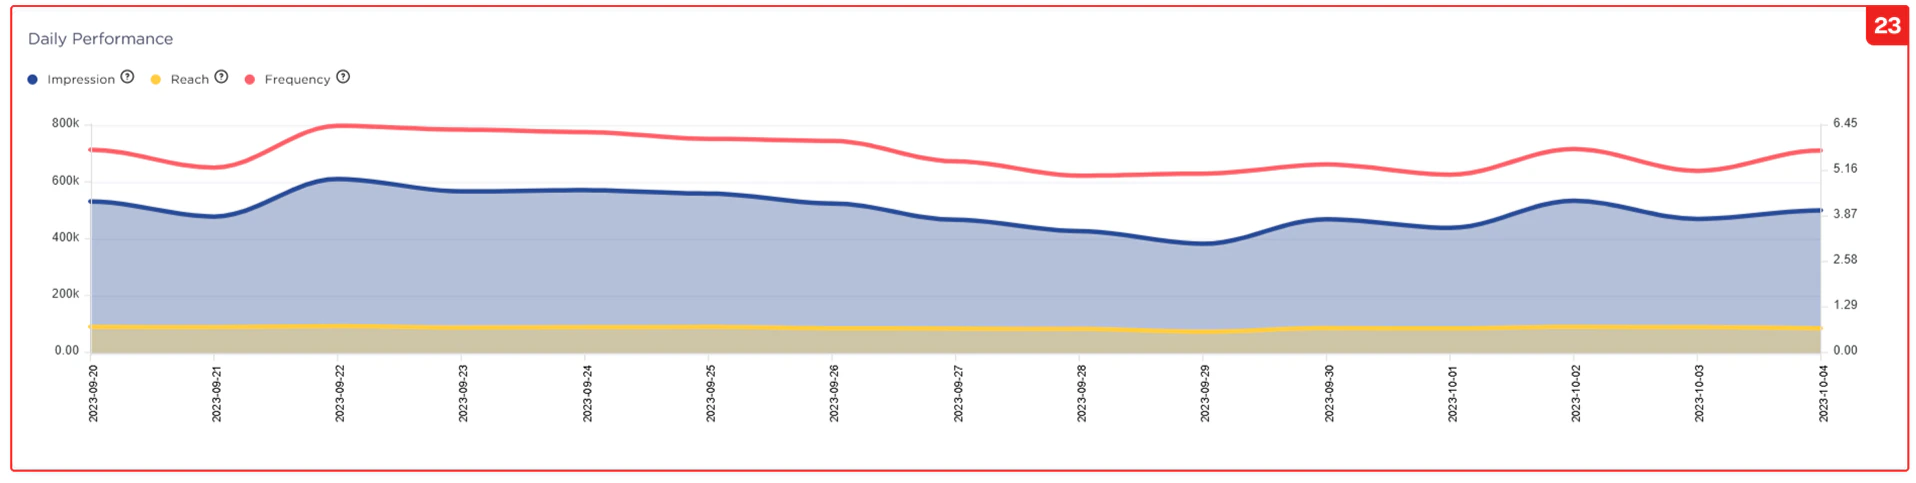
Impressions per Media Plan or Inventory
This Panel Tab is for setting the data display based on your preference: whether you want the breakdown per Inventory or by the Media Plan’s Creative Content.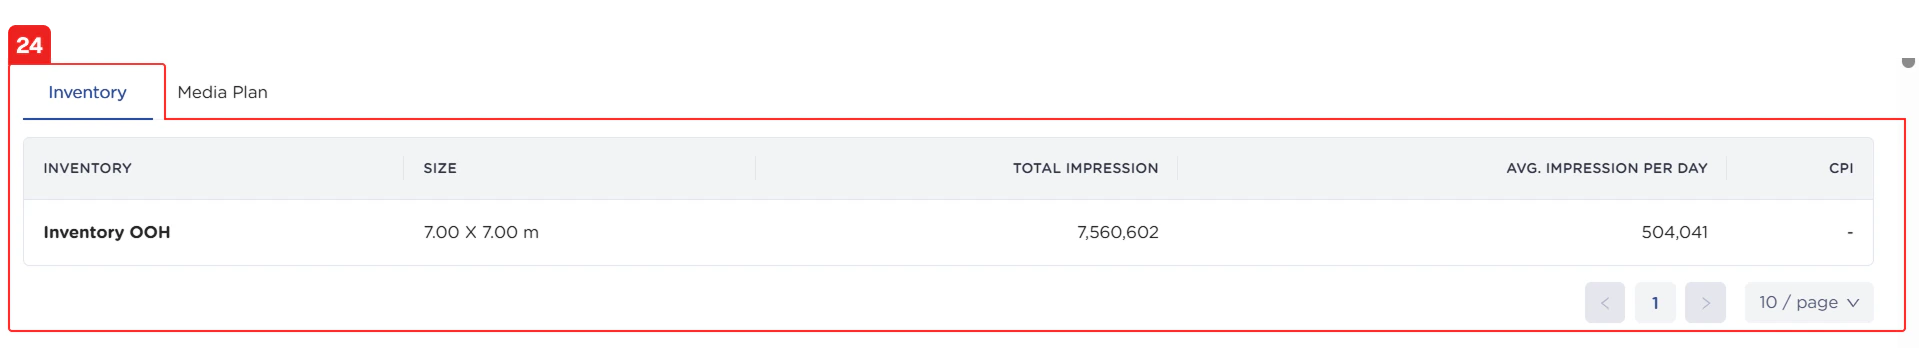
Age Demographics Graph
This graph displays the age demographics of the audience for a running campaign.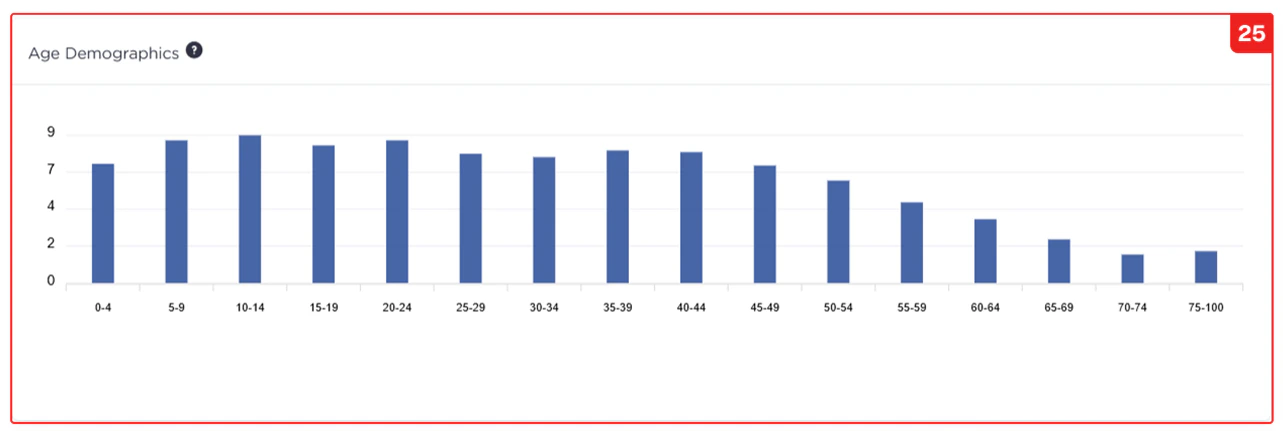
Gender Demographics Graph
This graph displays the gender demographics (male/female) of the audience for a running campaign.
Home Location Graph
This graph displays the home location demographics of the audience reached by a running campaign.
Office Location Graph
This graph displays the office location demographics of the audience reached by a running campaign.
Education Demographics Graph
This graph displays the education demographics of the audience for a running campaign.
Occupation Demographics Graph
This graph displays the occupation demographics (e.g., job sector or employment status) of the audience for a running campaign.
Audience Segmentation Graph
This graph displays the audience segmentation for a running campaign.
Audience Device OS Graph
This graph displays the Device Operating System (OS) used by the audience of a running campaign.
Places Visited Graph
This graph displays the locations or places visited by the audience reached by a running campaign.
Category of Places Visited Graph
This graph displays the category of locations or places visited by the audience reached by a running campaign.